


China Top 10 Filling Machine Manufacturers in 2026?
China’s filling machine industry is entering 2026 with stronger demand from food, beverages, pharmaceuticals, cosmetics, and household chemicals. Market reports from Grand View Research and Mordor Intelligence identify automation, hygienic design, and flexible production as major growth factors in filling equipment. Their findings also point to rising investment in servo controls, clean-in-place systems, and data monitoring.
This article introduces ten leading Chinese filling machine manufacturers for international buyers. The selection considers manufacturing experience, product range, export capability, certifications, after-sales service, and application expertise. Information is cross-checked through company records, industry directories, trade-show materials, and publicly available customer references. PMMI packaging research also highlights a continuing shift toward efficient, connected, and labor-saving packaging lines. That trend is visible in modern Chinese factories, where stainless-steel fillers operate beside conveyors, capping units, and inspection systems.
The ranking should not be treated as absolute. Company strengths vary by product viscosity, container shape, filling accuracy, production speed, and regional support. A supplier that performs well with bottled beverages may not suit sterile pharmaceutical applications. That distinction matters. Buyers should verify factory audits, test samples, filling tolerances, spare-parts availability, and compliance with destination-market requirements before purchasing. Some public data remains incomplete, especially for privately owned manufacturers. This is worth acknowledging. The following overview therefore combines market evidence with practical selection criteria, rather than relying only on brand visibility or promotional claims.
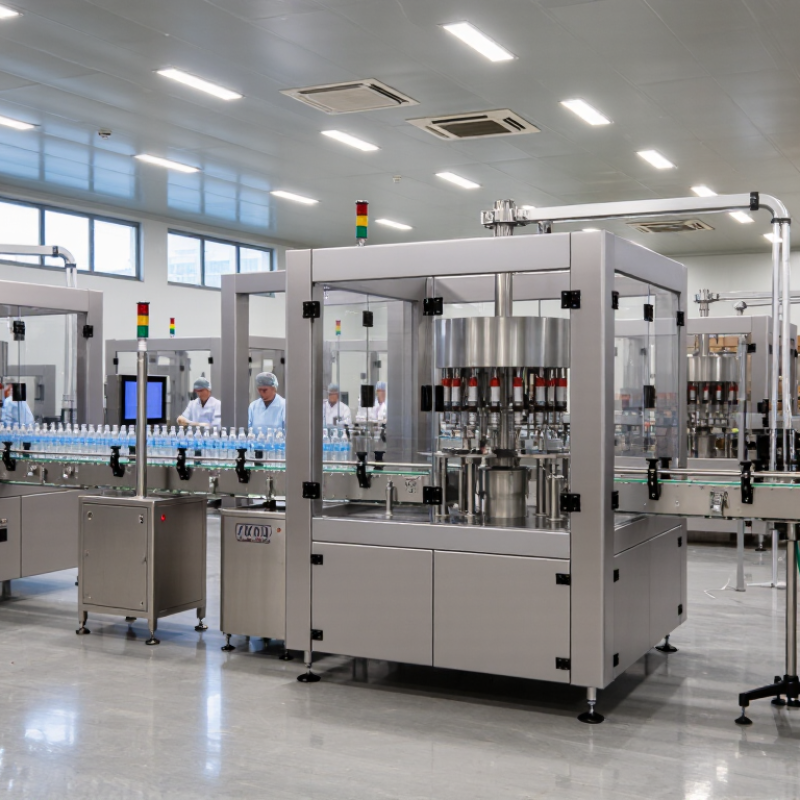
China’s 2026 Filling-Machine Market: Segments, Applications, and Key Data
China Top 10 Filling Machine Manufacturers in 2026?
China’s filling-machine market is splitting into clear application segments. Liquid food and beverages remain the largest users, especially for water, dairy drinks, sauces, and edible oils. Cosmetics, pharmaceuticals, and household chemicals demand tighter dosing and cleaner contact surfaces. According to Mordor Intelligence’s 2025 packaging machinery analysis, Asia-Pacific remains the fastest-growing regional market, supported by food processing expansion and automated production upgrades.
The equipment mix is also changing. Volumetric fillers suit stable liquids and high-speed lines. Piston and servo systems handle viscous products, including sauces and creams. Powder fillers serve milk powder, nutrition products, and industrial materials. Research and Markets’ 2024 packaging machinery forecasts identify automation, flexible formats, and reduced product loss as major investment drivers in China. A small error matters. At 120 bottles per minute, a one-percent dosing deviation can waste thousands of units monthly.
Factories now evaluate more than speed. They examine cleanability, changeover time, remote diagnostics, and compatibility with recyclable containers. China’s National Bureau of Statistics continues to report strong output across food and beverage manufacturing, creating practical demand for integrated filling lines. However, market forecasts differ because researchers define “filling machines” differently. That weakness deserves attention. Buyers should verify rated speed, tested accuracy, material certificates, and service response before comparing the leading ten manufacturers.
China Top 10 Filling Machine Manufacturers in 2026? - China’s 2026 Filling-Machine Market: Segments, Applications, and Key Data
A non-brand market view of the principal filling-machine segments, application areas, operating ranges, and 2026 demand indicators in China.
| Market Segment | Main Applications | Typical Filling Format | Indicative Share of New-Unit Demand | Typical Throughput Range | 2026 Demand Drivers | Key Technical and Compliance Requirements |
|---|---|---|---|---|---|---|
| Carbonated Beverage Filling | Soft drinks Sparkling water Energy drinks | PET bottles, glass bottles, and cans; counter-pressure filling for carbonated products. | 18–22% | 12,000–72,000 containers/hour, depending on container size and line configuration. | Replacement of mature high-speed lines, lighter PET containers, energy efficiency, and integrated blow-fill-cap systems. | CO₂ retention, hygienic design, accurate carbonation control, CIP capability, and food-contact material compliance. |
| Still Water Filling | Bottled water Purified water Natural mineral water | PET bottles, gallon containers, and selected glass formats. | 16–20% | 18,000–81,000 bottles/hour for large PET water lines. | High-volume automation, lower water and chemical consumption, lightweight packaging, and demand for compact line layouts. | Low-particle filling environment, hygienic product-contact surfaces, filtration integration, and stable fill-level control. |
| Hot-Fill Beverage Systems | Juice Tea drinks Fruit beverages | Heat-resistant PET bottles, glass bottles, and wide-mouth containers. | 8–12% | 6,000–36,000 containers/hour. | Growth in ready-to-drink beverages, extended shelf-life requirements, and demand for integrated pasteurization and filling systems. | Temperature management, product residence-time control, hygienic filling valves, and validated thermal-processing procedures. |
| Dairy and Plant-Based Beverage Filling | Milk Yogurt drinks Plant-based milk | HDPE bottles, PET bottles, cartons, cups, and aseptic packages. | 9–13% | 4,000–40,000 packages/hour, depending on package type and processing method. | Product diversification, chilled-chain expansion, smaller batch sizes, and demand for recipe flexibility. | Hygienic or aseptic design, gentle product handling, temperature control, allergen management, and CIP/SIP compatibility where applicable. |
| Edible Oil Filling | Cooking oil Blended oil Specialty oils | PET bottles, HDPE bottles, jerry cans, and small glass bottles. | 7–10% | 2,000–24,000 bottles/hour. | Servo-based dosing, multi-format packaging, lower product giveaway, and automated cap and label inspection. | Volumetric accuracy, anti-drip filling, oil-resistant seals, cleanability, and traceable batch control. |
| Sauce, Paste, and Condiment Filling | Soy sauce Vinegar Chili sauce Tomato paste | Glass bottles, PET bottles, squeeze bottles, jars, and pouches. | 8–12% | 1,000–18,000 containers/hour. | Convenience-food growth, high-viscosity product handling, flexible packaging, and demand for reduced cleaning downtime. | Positive-displacement or piston dosing, anti-stringing control, hygienic pumps, quick-change parts, and corrosion-resistant materials. |
| Pharmaceutical Liquid Filling | Oral liquids Syrups Disinfectants Ophthalmic products | Vials, ampoules, plastic bottles, glass bottles, and pre-sterilized containers. | 8–11% | 600–24,000 containers/hour, depending on sterility and inspection requirements. | Pharmaceutical quality upgrades, domestic equipment substitution, serialization, and demand for small-batch flexibility. | GMP-compatible design, validated dosing, cleanroom suitability, data integrity, automatic reject systems, and sterilization compatibility. |
| Cosmetics and Personal-Care Filling | Shampoo Skin care Liquid soap Perfume | Bottles, jars, tubes, sachets, and airless containers. | 7–10% | 500–20,000 units/hour. | Premium packaging, frequent SKU changes, e-commerce-oriented pack sizes, and demand for low-foam and high-viscosity filling. | Servo dosing, low-foam operation, anti-drip nozzles, cosmetic-grade contact materials, and rapid tool-less changeover. |
| Alcoholic Beverage Filling | Beer Wine Spirits Ready-to-drink alcohol | Glass bottles, cans, PET containers, and bag-in-box formats. | 6–9% | 3,000–72,000 containers/hour, mainly determined by product type and package format. | Premiumization, cans and small-format packages, low-oxygen filling, and modernization of medium-speed production lines. | Low dissolved oxygen, foam control, hygienic construction, accurate level or volume filling, and product-loss reduction. |
| Chemical, Household, and Industrial Liquids | Detergents Cleaners Lubricants Agricultural liquids | HDPE bottles, jerry cans, drums, IBC containers, and specialty containers. | 9–13% | 300–12,000 containers/hour; bulk systems may be specified by liters/minute. | Automation of labor-intensive plants, hazardous-liquid handling, accurate dosing, and demand for modular multi-product lines. | Chemical resistance, explosion-protection options where required, spill containment, viscosity compensation, and operator safety controls. |
Data note: Throughput figures are representative engineering ranges rather than guaranteed machine ratings. The demand-share figures are indicative 2026 planning estimates for China’s new filling-equipment demand by application segment and should not be interpreted as audited market-share statistics. Actual performance varies with product viscosity, container size, filling accuracy, hygiene level, line layout, and packaging material.
Related Posts
-
How to Choose the Right Filling Machine for Your Business Needs
-
Top Filling Machine Types for 2026 What You Need to Know?
-
Maximizing ROI on Best Bag Filling Machines Through Superior After Sales Support and Maintenance Savings
-
Maximize Efficiency: The Role of Bag Filling Machines in the $25 Billion Packaging Industry
-

How to Choose the Best Liquid Packaging Machine: Trends Shaping the Industry by 2025
-

The Future of Liquid Packaging Machines: Innovations Driving Efficiency and Sustainability in 2025